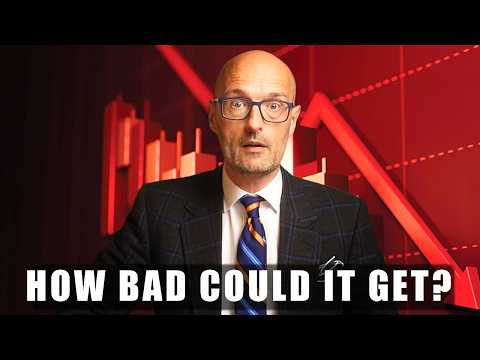
A rapid selloff in South Korea provides a useful framework for examining whether concentration, leverage, and enthusiasm around technology could create similar vulnerabilities in the United States. The presentation argues that Korea's decline followed an unusually potent combination: two stocks representing more than half of an index, a major preceding rally, heavily leveraged retail speculation, foreign selling, and growing doubts around AI. It then compares those ingredients with an American market where the largest companies command historically significant weight, valuations are elevated, margin debt is described as reaching roughly $1.5 trillion, and investors remain enthusiastic about AI. The comparison is deliberately alarming at first, but the video ultimately reaches a more restrained conclusion that the two markets are structurally different and a Korean-style collapse is not the most likely American outcome.
The South Korean example is most valuable when explaining how leverage can amplify an ordinary decline. According to the presentation, recently introduced 2X single-stock leveraged ETFs attracted 13.8 trillion won after the underlying rally had already become enormous. A warning from Korea's financial regulator was then followed by falling chip stocks, margin pressure, forced selling, and further declines, with regulators subsequently banning single-stock leveraged ETFs and increasing minimum deposits for existing products. That sequence provides a clear illustration of the feedback loop leverage can create when prices move against investors. The weakness is that the causal story is presented with considerable confidence: the regulator's warning, leveraged products, chip declines, foreign selling, and AI concerns are combined into a compact explanation without enough sourcing or market chronology to establish how much each factor actually contributed to the broader decline.
The American comparison begins with concentration and valuation, where the warning case has real substance even without assuming an imminent crash. The video says the ten largest S&P 500 companies represent roughly 37% of the index, with Nvidia and Apple approaching 15% together and information technology representing about 38%. A forward price-to-earnings ratio around 20.7 is described as elevated but not extraordinary relative to a 10-year average of 19, while a Shiller CAPE around 41 and a Buffett Indicator around 219 are used to argue that longer-term valuations are much more extreme. Those metrics support the narrower conclusion that investors are paying historically high prices by several measures, but valuation indicators are better at describing current conditions than identifying when a correction must occur.
Leverage, positioning, and insider activity deepen the cautionary case, although they vary considerably in evidentiary strength. The claimed $1.5 trillion in margin debt provides a plausible mechanism through which a decline could accelerate if leveraged investors are forced to sell. Professional money managers holding only about 3.6% in cash is presented as evidence that positioning is already heavily committed, while unusually high insider selling is framed more cautiously. The presenter appropriately acknowledges that executives sell for many reasons, including taxes, diversification, and predetermined plans, so insider sales are not treated as proof that corporate leaders expect a crash. That qualification is important because several indicators in the video are warning signs rather than reliable timing tools.
The bull case prevents the discussion from becoming a straightforward bubble prediction. Major-bank targets are cited ranging from relatively flat expectations to Goldman Sachs projecting the S&P 500 at 8,000, supported by strong earnings expectations rather than simply expanding valuations. The presentation points to blended earnings growth near 25%, revenue growth around 13%, widespread earnings beats, record highs in the equal-weight S&P 500, strong small-cap performance, corporate buybacks, automatic retirement-account inflows, and tight credit spreads. It also makes a meaningful distinction from the dot-com era by arguing that today's leading AI companies generate substantial revenue and profits, while much of the infrastructure buildout is being financed by established businesses rather than speculative companies with little revenue. Those differences do not establish that current valuations are justified, but they make a simple replay of 2000 or South Korea an incomplete analogy.
The bear case is strongest when it stops requiring an external disaster and instead asks what happens if optimistic assumptions merely disappoint. The video argues that current prices depend on continued earnings growth, expanding margins, successful AI monetization, manageable rates, and avoidance of recession. Its hypothetical scenario of weaker earnings combined with a price-to-earnings multiple falling to 16 illustrates how a large market decline could occur through valuation compression rather than financial collapse. The discussion of hyperscalers spending roughly $534 billion in capital expenditures through 2027 against about $340 billion in additional operating cash flow similarly raises a legitimate question about whether enormous AI investment will generate sufficient returns. Still, describing this as spending $1.57 for every dollar “they get back” simplifies the relationship between capital expenditure, operating cash flow growth, asset creation, and eventual returns.
The broader presentation is less convincing where statistics are treated as self-explanatory. The claim that the S&P 500 has moved opposite the majority of its stocks on more than half of trading days is compared with conditions around 2000, but the implications of that divergence are not explored enough to show why it should predict future weakness. Tight high-yield spreads are used in the bull case as evidence that bond markets see little trouble, then later become part of the bear case because investors are receiving little compensation for risk. Both interpretations can coexist, but the tension deserves more explanation. Likewise, bank price targets and strategist probabilities illustrate uncertainty rather than establish likely outcomes, particularly when the same institutions can publish dramatically different scenarios depending on assumptions.
The closing advice is considerably more conservative than the opening warning. Rather than recommending investors flee stocks because America is about to repeat Korea's experience, the presenter emphasizes emergency savings, diversification, avoiding leverage, maintaining the ability to hold through large declines, and accepting that neither bullish nor bearish forecasts can reliably predict what happens next. The claim that no historical 20-year S&P 500 holding period has produced a negative result is offered as reassurance for long-term investors, though the presentation does not explain the precise dataset, treatment of dividends, inflation, or whether future outcomes must resemble historical ones. More importantly, the recommendation to keep buying through uncertainty fits the video's actual conclusion: concentration and leverage deserve attention, but evidence of vulnerability is not the same thing as evidence that a crash is imminent.
Pros
- Uses South Korea's leveraged selloff to explain clearly how concentration, borrowing, falling prices, and forced selling can reinforce one another.
- Compares Korean and American market structures instead of assuming that similar enthusiasm around AI means the same outcome must follow.
- Valuation, margin debt, concentration, earnings, market breadth, buybacks, and credit conditions give both the bullish and bearish arguments multiple concrete foundations.
- The presenter explicitly acknowledges that insider selling has many explanations and does not treat it as definitive evidence of an approaching crash.
- Strong earnings and established AI-company revenues provide an important counterweight to simplistic comparisons with the dot-com bubble.
- The bear case usefully demonstrates that a substantial correction could result from lower expectations and valuation compression without requiring a recession or systemic crisis.
- The final emphasis on liquidity, diversification, avoiding leverage, and long holding periods is much more measured than the video's initially alarming setup.
Cons
- The explanation of South Korea's decline compresses regulatory warnings, leveraged ETFs, foreign selling, chip weakness, and AI concerns into a causal narrative without enough sourcing to establish their relative importance.
- Historical valuation indicators demonstrate that the U.S. market is expensive by several measures but cannot determine when or whether a major correction will occur.
- The comparison between hyperscaler capital expenditures and operating cash flow growth oversimplifies how infrastructure spending should be evaluated against future economic returns.
- Tight credit spreads are used as both bullish evidence of confidence and bearish evidence of insufficient risk compensation without fully reconciling those interpretations.
- Bank targets and strategist scenarios receive substantial attention despite being forecasts based on assumptions rather than evidence of what markets will actually do.
- The claim about historical 20-year S&P 500 returns would benefit from clarification about dividends, inflation, methodology, and the limits of using past performance to imply future results.
- The dramatic framing of an American AI bubble potentially following Korea is stronger than the video's own eventual conclusion that structural differences make a comparable crash unlikely.
The video is most useful as a stress test of the American rally rather than a prediction that South Korea has revealed America's immediate future. Concentration, leverage, elevated valuations, ambitious AI spending, and demanding earnings expectations create legitimate vulnerabilities, while strong profits, broader participation, institutional demand, and structural differences from Korea complicate the crash narrative considerably. Some statistics and causal claims need more context than they receive, but the willingness to develop both sides and ultimately reject certainty produces a more responsible conclusion than the alarming premise initially suggests.